
The Gini coefficient (also known as the Gini index or Gini ratio) is a measure of statistical dispersion developed by the Italian statistician and sociologist Corrado Gini and published in his 1912 paper "Variability and Mutability" (Italian: Variabilità e mutabilità).

It has found application in the study of inequalities in disciplines as diverse as sociology, economics, health science, ecology, chemistry, engineering and agriculture.
It is commonly used as a measure of inequality of income or wealth.
Worldwide, Gini coefficients for income range from approximately 0.23 (Sweden) to 0.70 (Namibia) although not every country has been assessed.
Definition
 |
| The graph shows that the Gini is equal to the area marked 'A' divided by the sum of the areas marked 'A' and 'B' (that is, Gini = A/(A+B)). It is also equal to 2*A, as A+B = 0.5 (since the axes scale from 0 to 1). |
The line at 45 degrees thus represents perfect equality of incomes. The Gini coefficient can then be thought of as the ratio of the area that lies between the line of equality and the Lorenz curve (marked 'A' in the diagram) over the total area under the line of equality (marked 'A' and 'B' in the diagram); i.e., G=A/(A+B).
The Gini coefficient can range from 0 to 1; it is sometimes expressed as a percentage ranging between 0 and 100. More specifically, the upper bound of the Gini coefficient equals 1 only in populations of infinite size. In a population of size N, the upper bound is equal to 1 − 2 / (N + 1).
A low Gini coefficient indicates a more equal distribution, with 0 corresponding to complete equality, while higher Gini coefficients indicate more unequal distribution, with 1 corresponding to complete inequality.
To be validly computed, no negative goods can be distributed. Thus, if the Gini coefficient is being used to describe household income inequality, then no household can have a negative income.
When used as a measure of income inequality, the most unequal society will be one in which a single person receives 100% of the total income and the remaining people receive none (G=1); and the most equal society will be one in which every person receives the same income (G=0).
Some find it more intuitive (and it is mathematically equivalent) to think of the Gini coefficient as half of the relative mean difference. The mean difference is the average absolute difference between two items selected randomly from a population, and the relative mean difference is the mean difference divided by the average, to normalize for scale.
Gini coefficient of income distributions
Using the Gini can help quantify differences in welfare and compensation policies and philosophies. However it should be borne in mind that the Gini coefficient can be misleading when used to make political comparisons between large and small countries
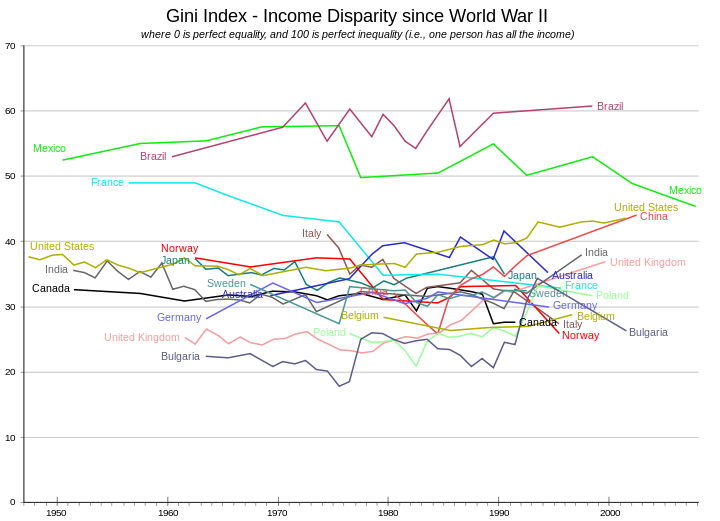
The Gini index for the entire world has been estimated by various parties to be between 0.56 and 0.66. The graph shows the values expressed as a percentage, in their historical development for a number of countries.
No comments:
Post a Comment